Dashboard
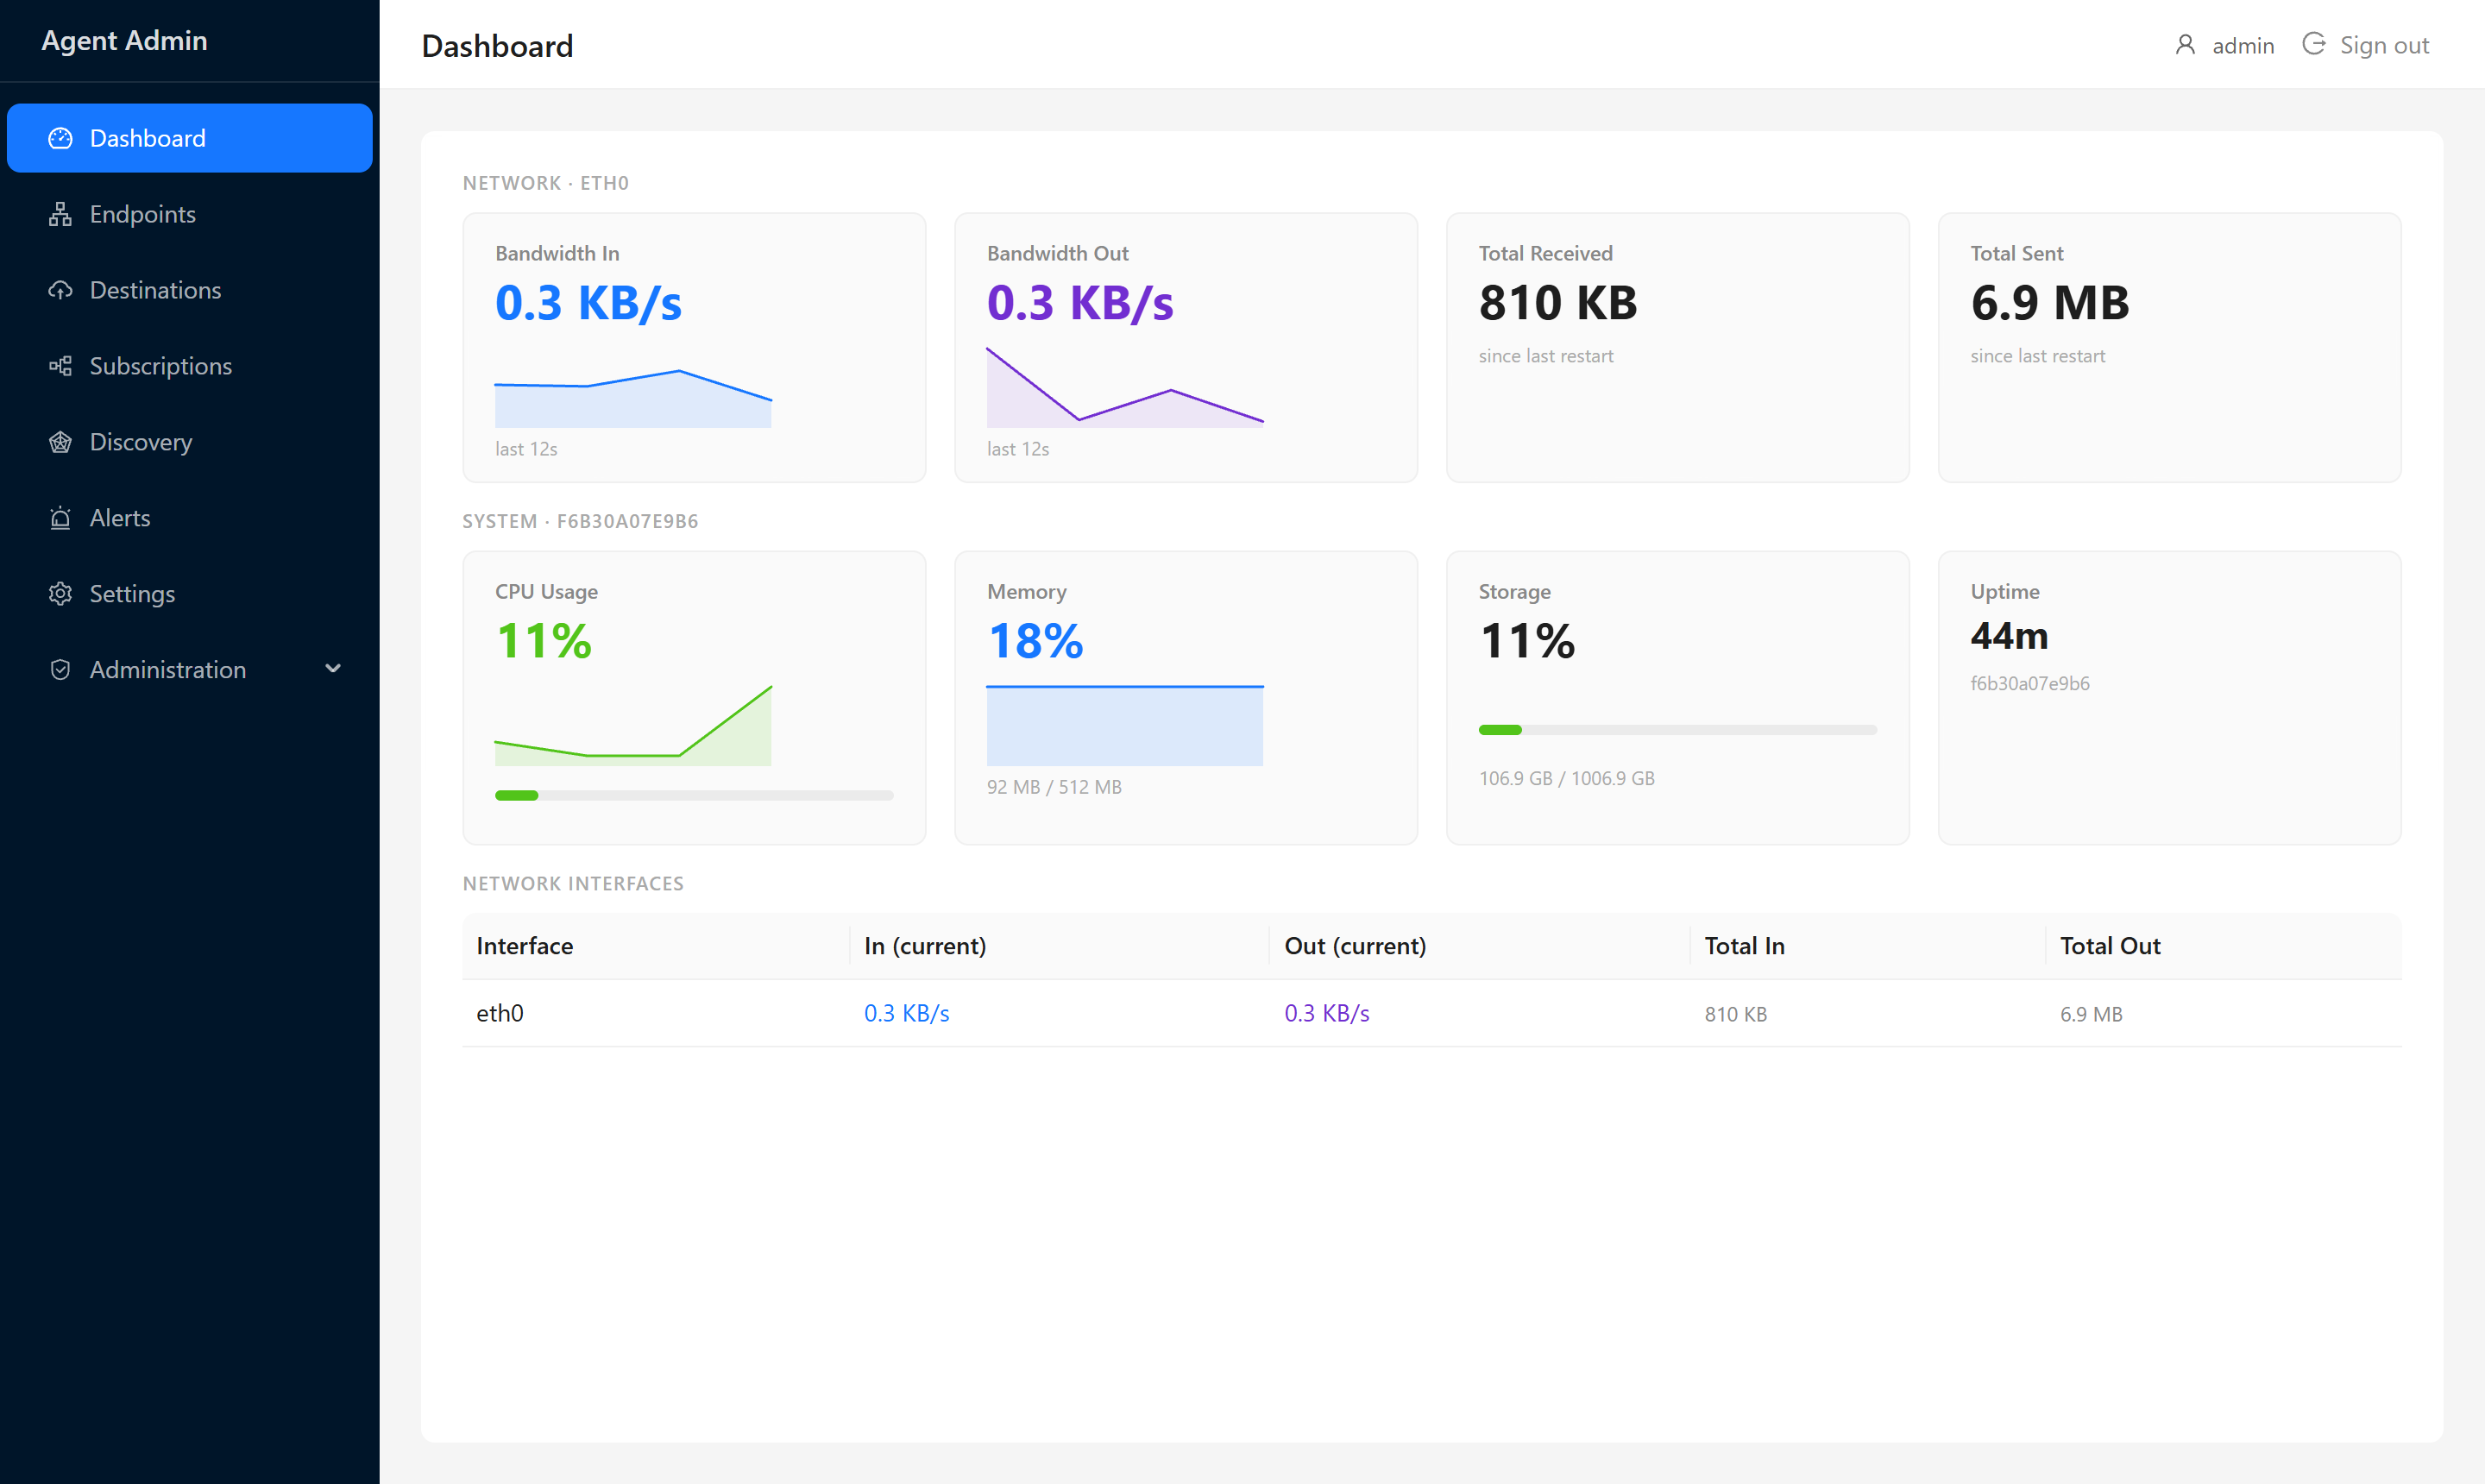
The Dashboard gives you a live view of what the agent's host machine is doing. It refreshes every 3 seconds and keeps a rolling 3-minute history for the sparkline charts.
Network
The top row shows bandwidth for the busiest non-loopback network interface on the device.
| Widget | What it shows |
|---|---|
| Bandwidth In | Current inbound data rate (KB/s or MB/s) |
| Bandwidth Out | Current outbound data rate |
| Total Received | Cumulative bytes received since last restart |
| Total Sent | Cumulative bytes sent since last restart |
The sparkline charts let you spot spikes at a glance without digging into logs.
Below the widgets there's a full interface table listing all network adapters individually.
System
The second row covers the host machine's resources.
| Widget | What it shows |
|---|---|
| CPU Usage | Current CPU load as a percentage |
| Memory | Used vs. total RAM, as a percentage and in MB/GB |
| Storage | Disk usage on the root filesystem |
| Uptime | How long the device has been running |
Color coding gives you an immediate sense of health:
- Green — within normal range
- Orange — elevated, worth watching
- Red — high load, consider investigating
CPU turns orange above 70% and red above 90%. Memory turns orange above 75% and red above 90%.
What It Won't Tell You
The dashboard shows host-level metrics only. It doesn't show per-endpoint data rates, MQTT message counts, or publication success rates — those are in the logs for now.