Alerts
The Alerts section covers two things: the live list of anomaly alerts that have fired, and the rules that define what counts as an anomaly.
How Anomaly Detection Works
The agent learns what "normal" looks like for each metric by observing readings over time. It builds a statistical model per metric (per device, per time slot) and raises an alert when a new reading falls outside the expected range.
This all runs locally — no cloud connection required. The models update continuously as new data arrives.
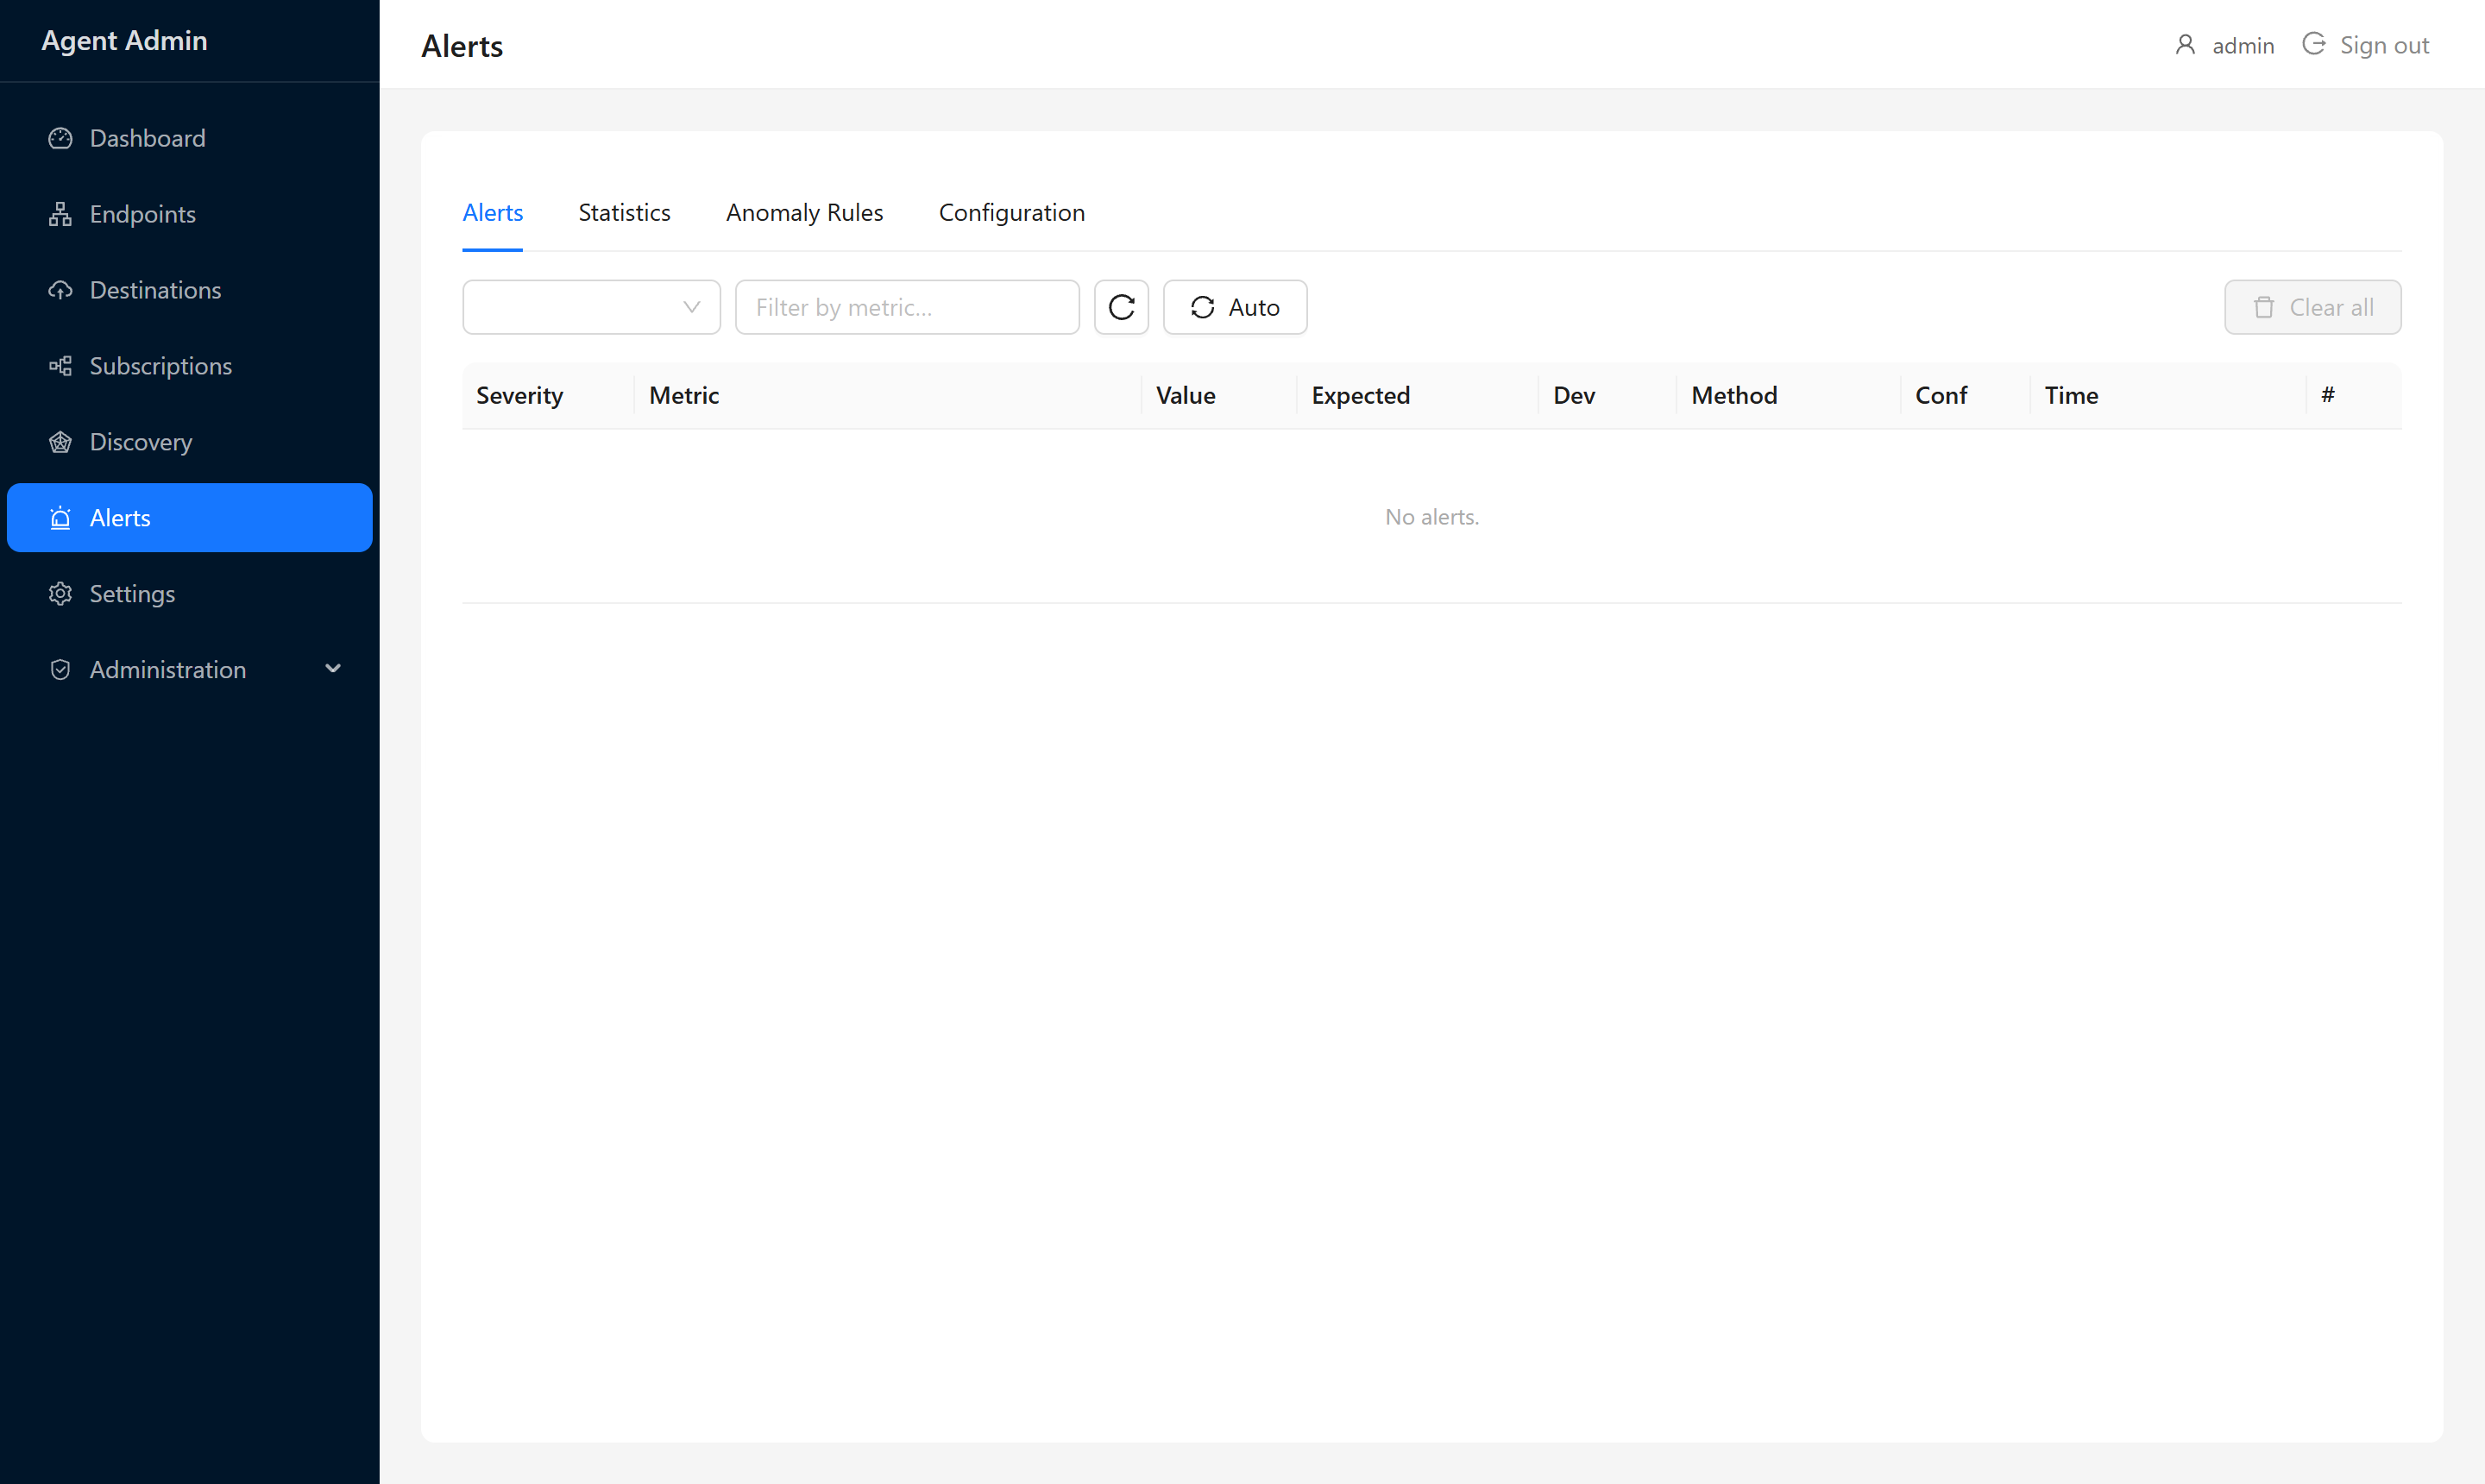
The Alerts Tab
The Alerts tab shows all anomaly alerts that have been triggered. Each alert includes:
- Metric — the reading that triggered it
- Device — which endpoint the reading came from
- Severity — critical, warning, or info
- Value — what the sensor read
- Expected range — what the model predicted
- Timestamp — when it happened
You can filter by severity or metric name and clear alerts once you've reviewed them.
Statistics Tab
The Statistics tab shows the current state of the detection models — one row per metric, with the anomaly score, trend, and baseline range. This is useful for understanding why something did or didn't trigger an alert.
An anomaly score near 0 means the reading is within the expected range. A score above the configured threshold triggers an alert.
Anomaly Rules
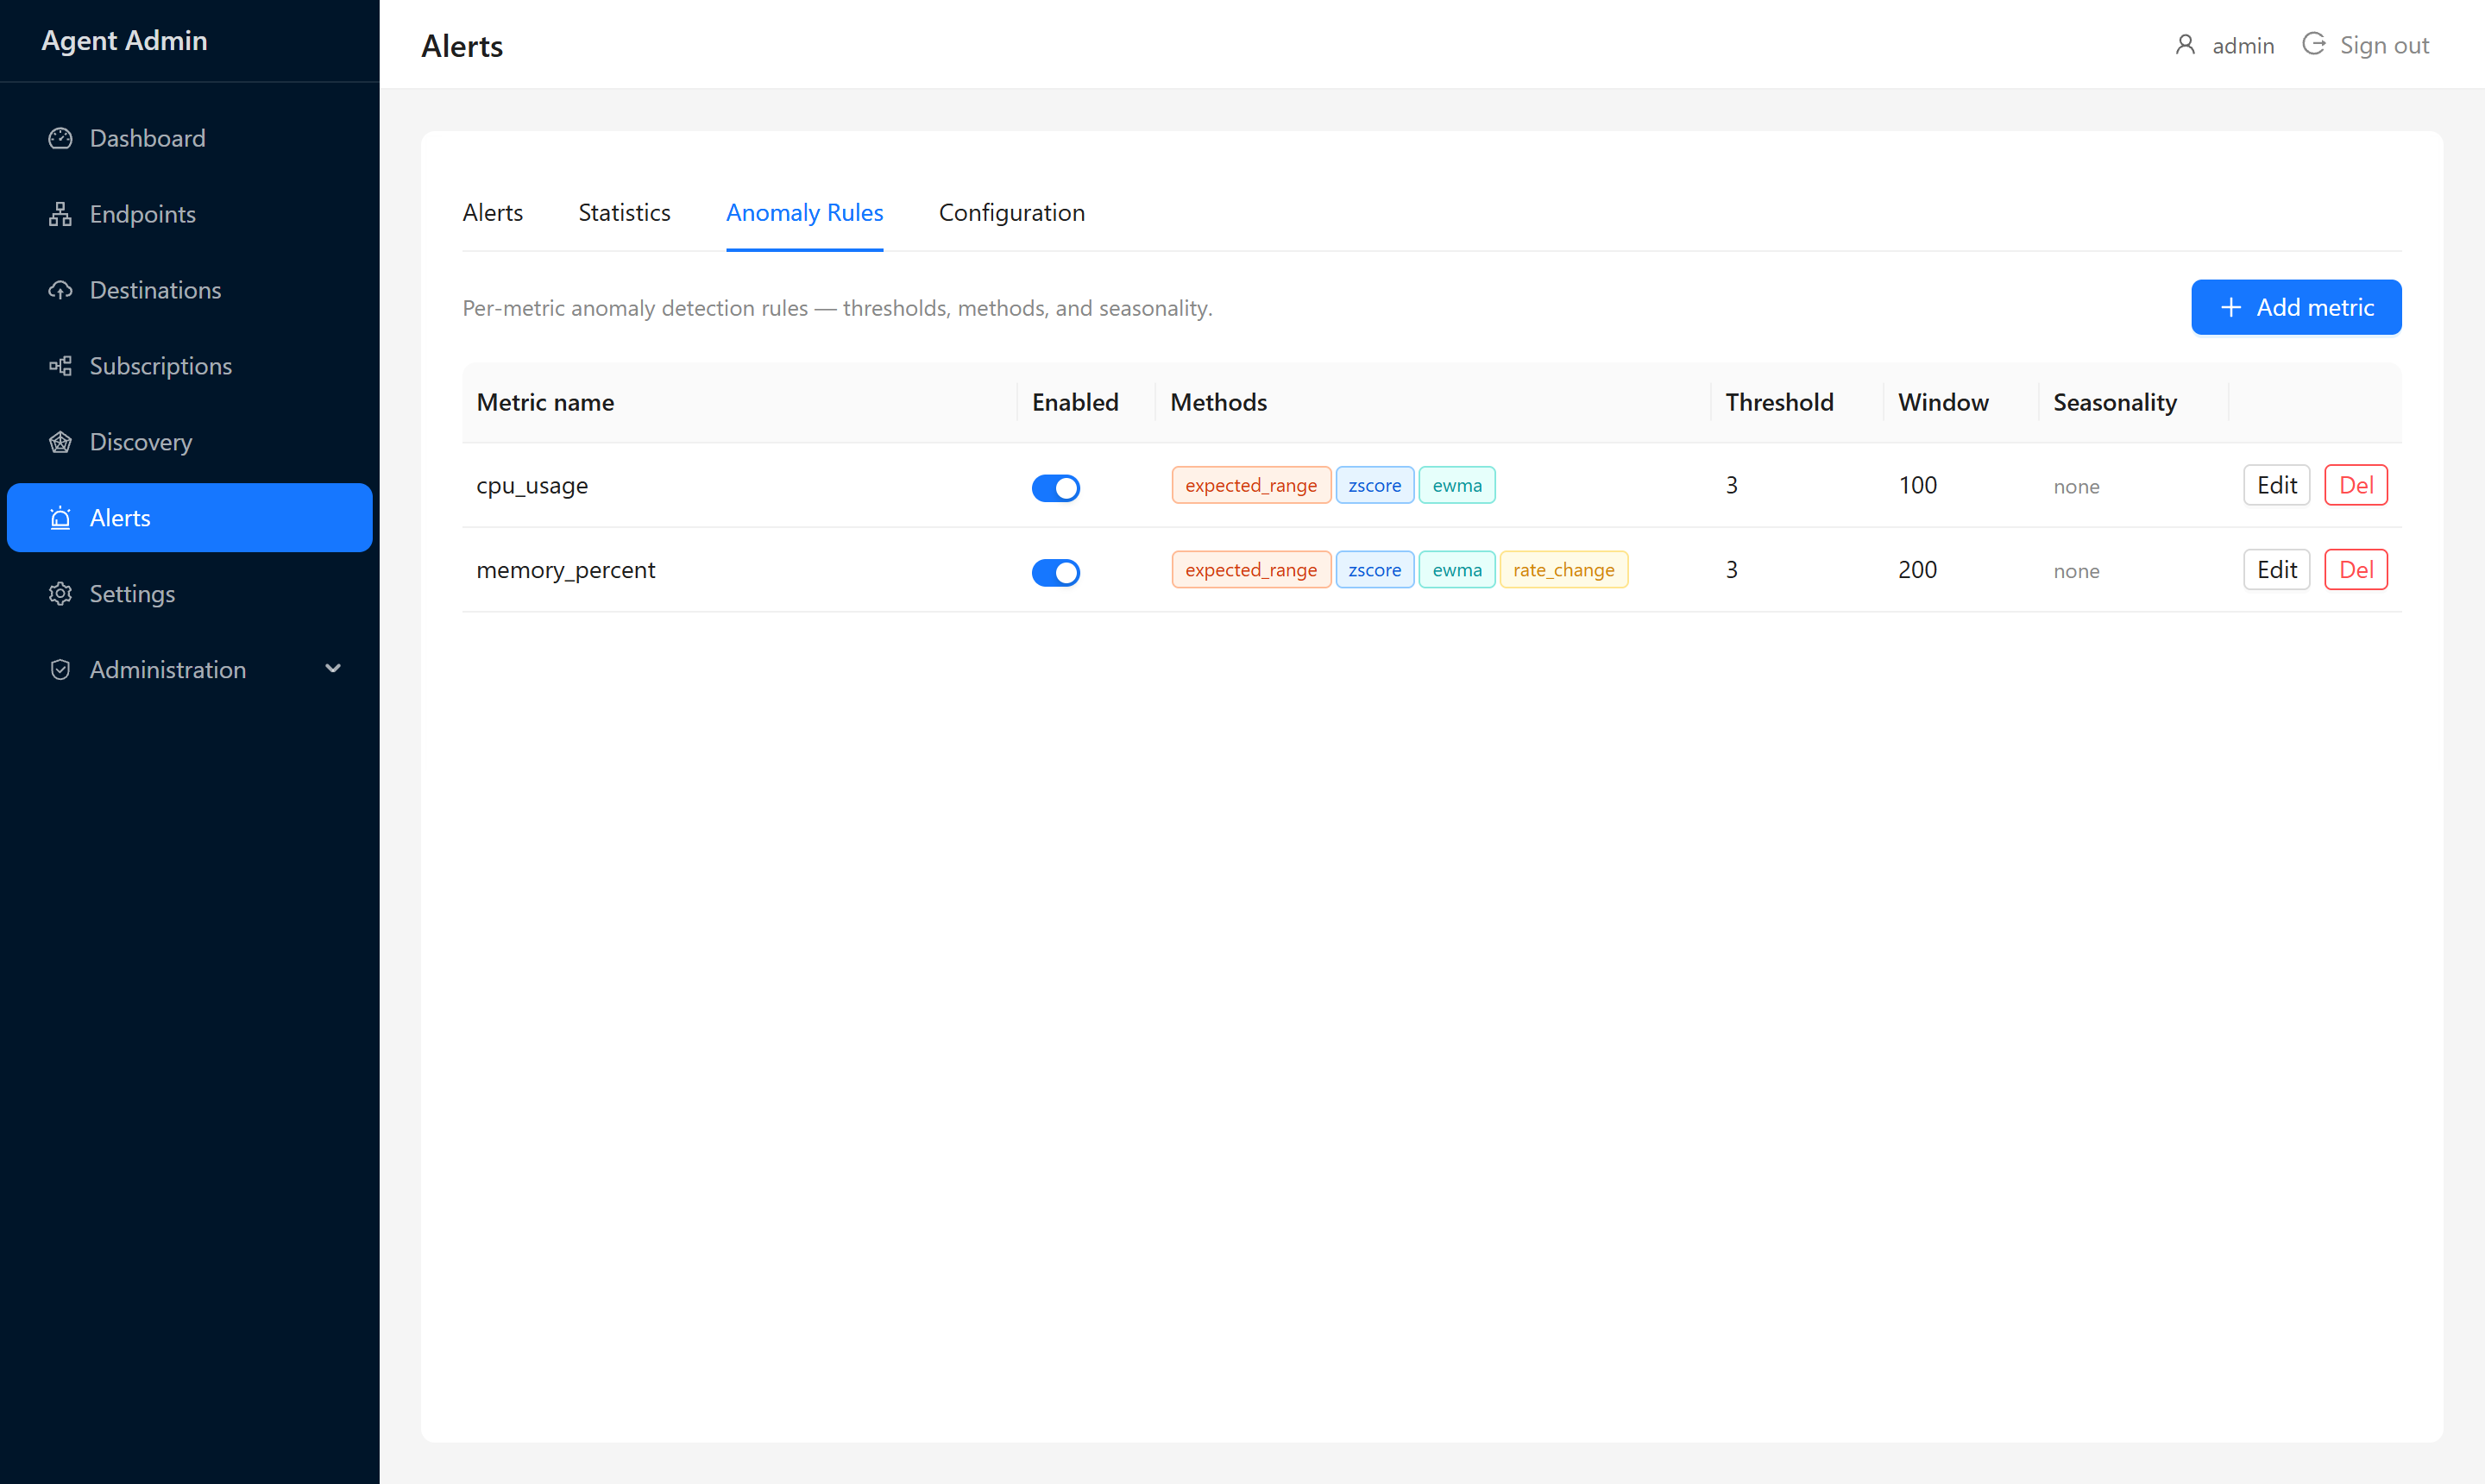
Anomaly rules let you fine-tune detection per metric. You can:
- Enable or disable detection for specific metrics
- Choose the detection method
- Adjust the sensitivity — a higher threshold means only larger deviations trigger alerts
- Set the time window — how much history the model considers
Detection Methods
| Method | How It Works | Best For |
|---|---|---|
| Z-Score | Measures how many standard deviations a reading is from the mean | Sensors with stable, normally-distributed values |
| EWMA | Exponentially weighted moving average — gives more weight to recent readings | Slowly drifting values like temperature |
| Rate of Change | Detects sudden jumps between consecutive readings | Equipment that should change gradually |
| Expected Range | Simple min/max bounds you set manually | When you know the acceptable range |
| Fusion | Combines multiple methods and weighs the results | Most reliable for general use |
Adding an Anomaly Rule
- Go to Alerts → Anomaly Rules and click Add Rule.
- Select the metric from the autocomplete list (populated from live data).
- Choose a detection method.
- Set the sensitivity/threshold — start with the default and adjust based on how many false positives you see.
- Save.
The rule takes effect immediately. The model begins learning from the next readings that come in for that metric.
Configuration Tab
The Configuration tab controls global anomaly detection settings:
| Setting | What It Does |
|---|---|
| Detection Enabled | Master on/off switch for all anomaly detection |
| Sensitivity | Global default sensitivity (overridden by per-metric rules) |
| Alert Routing | Where to send alerts (local only, or to a destination) |
| Storage | How long to keep alert history |
Changes take effect immediately without an agent restart.
Tips
- If you're seeing too many alerts on a particular metric, either raise the threshold on its rule or switch to the Fusion method, which is more conservative.
- The Statistics tab shows the anomaly score in real time — a good way to check whether a rule change has the effect you expected without waiting for an alert to fire.
- Anomaly detection needs some data to train on before it starts producing reliable results. Give it at least a few hours of normal operation first.